
This hackathon is a pre-event for the Postman Student Summit held August 7-8, 2021. Register here!
Overview
Charts, maps, styles, oh my! Data is as powerful as it is understandable.
Use Postman’s visualizer feature to make sense of data returned from an API in a way that adds value and understanding.
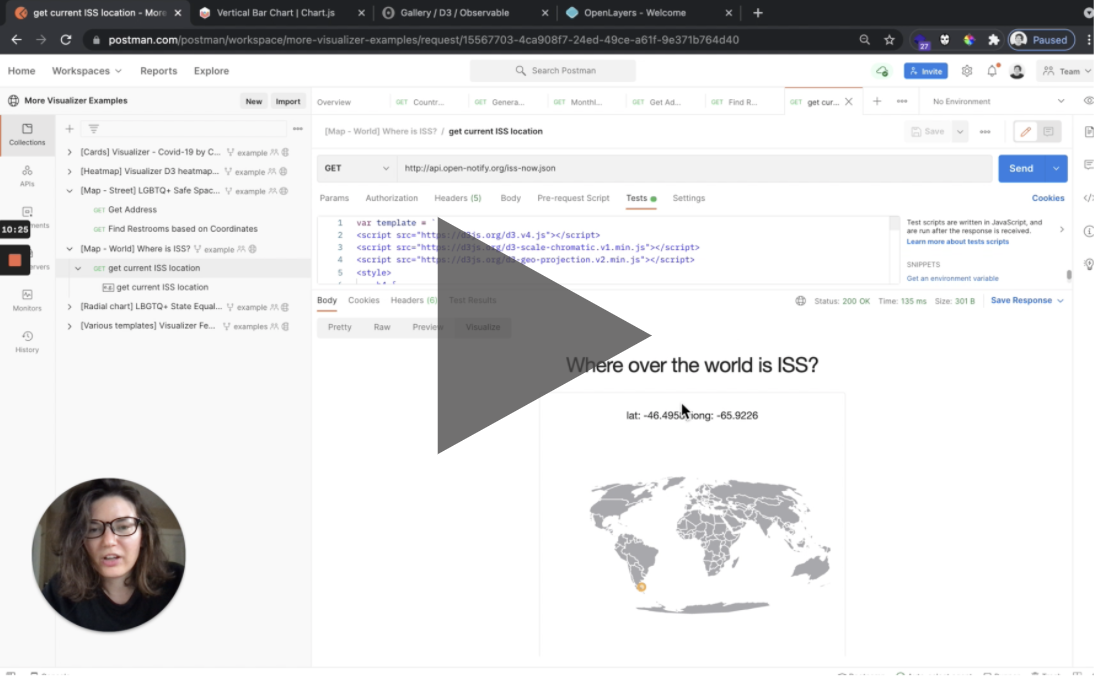
A pie chart of a Github user’s most used programming languages? A map showing the location of the International Space Station at this very moment? Get creative!
To visualize data you can use simple HTML and CSS, or incorporate any visualization libraries of your choice such as d3.js, chart.js, OpenLayers street maps etc.
How to participate
-
Create a free Postman account here
-
In your public workspace, add a collection with at least one request to an API
-
Visualize the response data your way using the Visualizer feature!
-
Include your collection URL and a short video demo (<2 mins) in your submission
-
Register for the Postman Student Summit to catch the winner announcement!
Schedule
| Date | Time | Event |
| Jul 14 | 7am PT / 10am ET / 7:30pm IST | Hackathon begins! |
| Jul 16 | 8am PT / 11am ET / 8:30pm IST | Discord Office hours #1 |
| Jul 21 | 9am PT / 12pm ET / 9:30pm IST | Discord Office hours #2 |
| Jul 23 | 8am PT / 11am ET / 8:30pm IST | Discord Office hours #3 |
| Jul 28 | 11am PT / 2pm ET / 11:30pm IST | Submission deadline! |
| Jul 29 | 12am PT / 3am ET / 12:30pm IST | People's Choice voting opens |
| Aug 4 | 11am PT / 2pm ET / 11:30pm IST | People's Choice voting closes |
| Aug 7 | 7:30am PT / 10:30am ET / 8pm IST | Postman Student Summit starts (register) |
| Aug 8 | TBD (coming soon!) | Winner announcement at Postman Student Summit |
Rules
1. Solo submissions only
2. One submission per person
3. Must use Postman’s Visualizer feature
4. Project must be started and completed within the Hackathon start and end date (Jul 14 - 28)
5. Submissions must include a short video showing your project in use (< 2 mins)
6. No racist/violent/sexual/offensive content
Learning Resources
Example Submissions
Get inspired! To see the visualizations in action, fork these collections and run their requests. Then check the "Visualize" tab in the response.
A note about prizes
Due to International prize law, we cannot award prizes with cash value to students residing in the following regions: Brazil, Quebec, Cuba, Iran, Syria, North Korea, Crimea. Students in these regions can still submit projects and compete for the non-cash-value prizes: a 1on1 with a Postmanaut and a feature in the Postman blog.
Got questions?
Check out our FAQ! Is your question not answered there? Come ask it in the #hackathon channel in the Postman Student Community Discord!
Requirements
Make sure your request is saved to a collection in a public workspace, then supply these two things in your submission:
1. A link to a short video (< 2 mins) demoing your visualization in action!
Accepted video platforms: YouTube, Facebook Video, Vimeo, Youku
2. A link to the collection that contains your request with a visualized response. (How to get URL)
This URL must be obtained from the URL bar when viewing your collection in Postman for Web. To obtain the URL: a) make sure your workspace is Public!!! b) navigate to https://postman.com/explore, then c) navigate to your public workspace with your submission collection, click the collection, then copy the URL.
Prizes
Champion (chosen by Postman)
- 45 min 1on1 Career Advice Session with a Postman Employee
- Raspberry Pi 4 Kit
- 100 USD Postman Swag Gift Card
- Feature in the Postman blog
People's Choice (voted by peers)
- 100 USD Postman Swag Gift Card
- Feature on the Postman blog
Devpost Achievements
Submitting to this hackathon could earn you:
Judges

Smit Patel
Director, Special Initiatives @Postman

Claire Froelich
Student Community Manager @Postman

Ali Mustufa
Student Community Manager @Postman

Mei Eyre
Student Community Manager @Postman

Som Nath
Student Community Manager @Postman
Judging Criteria
-
Usefulness
How much value and insight does your visualization add to response data from an API? -
Documentation
How well documented is your collection? How well does your short video (<2 mins) demonstrate your visualization? -
Style
How visually stunning, readable and clean is your visualizer output? -
Technical Merit
How cleverly and skillfully did your project visualize data? Extra merit given to submissions that incorporate elements such as custom scripting logic, third party style or scripting libraries, interactive components, mock servers or a custom-built API.
Questions? Email the hackathon manager
Tell your friends
This site is protected by reCAPTCHA and the Google Privacy Policy and Terms of Service apply.